Accelerate Productivity in 2025
Reignite Growth Despite the Global Slowdown
Staying ahead of the technology curve means strengthening your competitive advantage. That is why we give you data-driven innovation insights into the utility sector. This time, you get to discover 5 hand-picked data visualization solutions for utility companies.
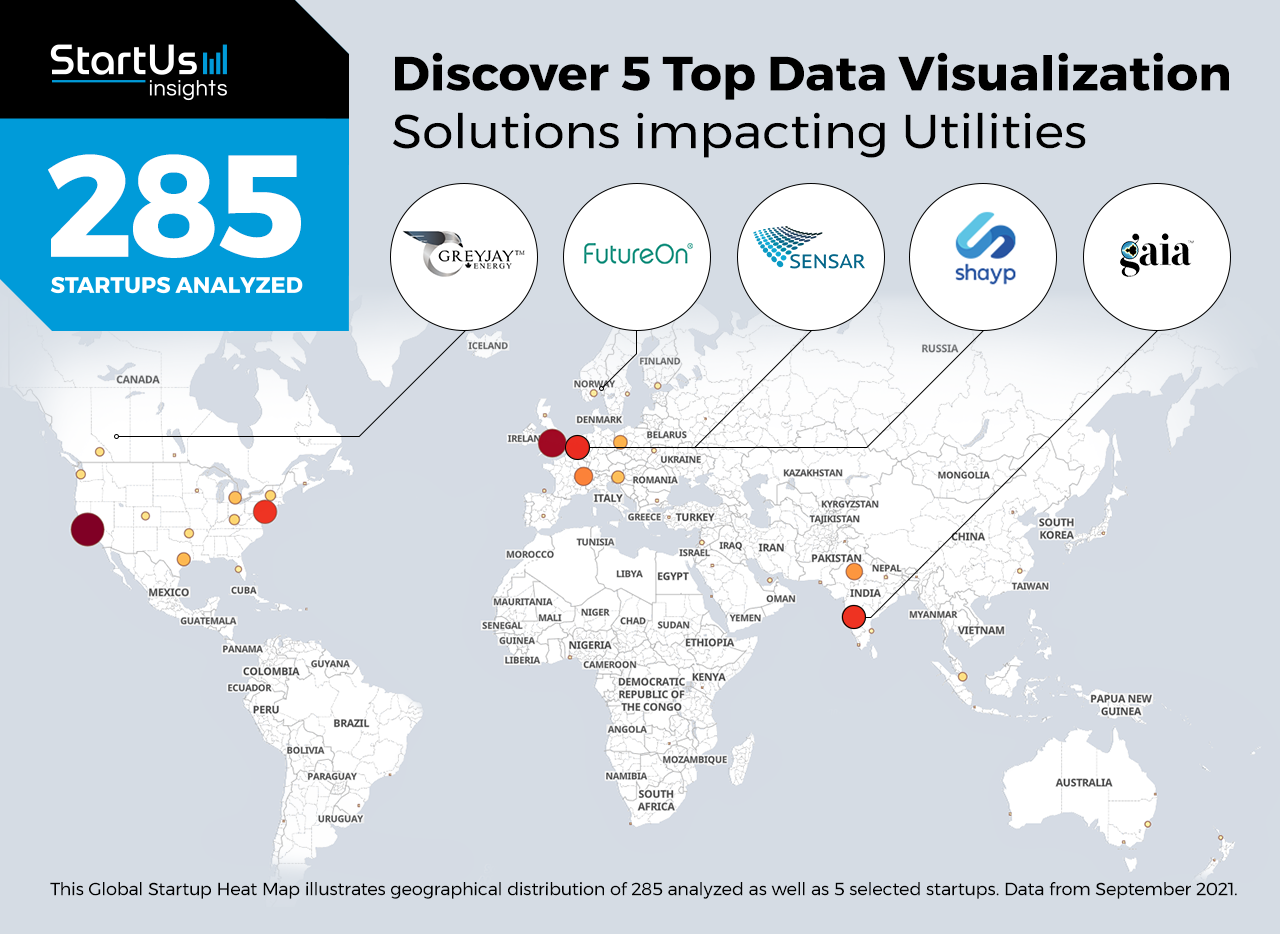
Out of 285, the Global Startup Heat Map highlights 5 Top Data Visualization Solutions for Utility Companies
The insights of this data-driven analysis are derived from the Big Data & Artificial Intelligence-powered StartUs Insights Discovery Platform, covering 2 093 000+ startups & scaleups globally. The platform gives you an exhaustive overview of emerging technologies & relevant startups within a specific field in just a few clicks.
The Global Startup Heat Map below reveals the distribution of the 285 exemplary startups & scaleups we analyzed for this research. Further, it highlights 5 data visualization startups that we hand-picked based on criteria such as founding year, location, funding raised, and more. You get to explore the solutions of these 5 startups & scaleups in this report. For insights on the other 280 data visualization solutions for utility companies, get in touch.
GreyJay Energy offers an Energy Optimization Dashboard
Load balancing is a critical function of energy utilities as it allows them to balance demand and production. The process collects and integrates data from power plants, grids, and smart meters. Startups develop software platforms that transform this data into actionable insights. To make the task easier for energy utility managers, these platforms display insights in intuitive dashboards and graphical interfaces.
Canadian startup GreyJay Energy develops a software-as-a-service platform for energy utilities. It uses AI algorithms to analyze utility data and identifies and quantifies energy flows. The energy optimization dashboard visualizes equipment performance, enabling utilities to benchmark and analyze energy and water use. Further, it provides peak load forecasting and calculations of greenhouse gas (GHG) emissions reductions.
FutureOn provides Offshore Data Visualization
The rough terrain and harsh environment make offshore projects challenging for oil and gas companies. Additionally, there is also a risk of damaging subsea cables or other assets. Startups use digital twins and other technologies to map the surface and assets. Accessible as user-friendly charts and interactive dashboards, these solutions provide critical visibility to subsea operators.
Norwegian startup FutureOn offers an offshore data visualization platform. The startup’s platform, FieldTwin Design, visualizes subsea developments. It analyzes data from bathymetry maps, wells, pipelines, reservoirs, and equipment to inform the design of subsea projects. This provides well planners actionable insights for developing well fields, setting up new assets, and repurposing existing projects.
Shayp builds Water Monitoring Technology
Breakages due to environmental changes, corrosion, or roots are a frequent occurrence in water pipelines. Monitoring water grids manually as the grids in cities are complex and run into hundreds or thousands of kilometers. This is why WaterTech startups offer a range of water grid monitoring solutions. Such solutions visualize data into easily digestible maps to allow water utilities to rapidly pinpoint leaks.
Belgian startup Shayp provides a non-invasive water monitoring technology. 2ZERO, the startup’s water management software, remotely monitors and displays the status of plumbing systems. It identifies leakage or abnormal water consumption patterns, sending alerts when persistent leaks occur. The startup’s solution allows water utility technicians to prioritize repairs, thereby saving maintenance costs.
Gaia offers Smart Utilities Metering
With developments in smart meters and other Internet of Things (IoT) devices, utility companies now have access to meter-level information on consumption. The granular data obtained from smart meters help companies serve their customers better as well as manage grids more effectively. This is why utility companies are increasingly adopting automated metering infrastructure (AMI) solutions that quantify and map water or energy consumption data.
Indian startup Gaia develops a Software-as-a-Service (SaaS) platform for connected sites. For water utilities, the startup’s solution provides real-time data and analytics of water consumption. It generates usage dashboards that provide detailed information on meter-wise consumption, leakages, and other data. The startup’s solution also finds applications in smart cities, retail, logistics, and real estate.
Sensar enables Landscape Monitoring
Utility companies, as well as cities, survey the land topology before setting up major infrastructure. Even for built assets, land deformation due to seismic or other activities presents significant risks. This is why startups use radar data to map and monitor landscapes. Overlaying landscape information with existing assets helps utility managers understand the risk to their projects.
Dutch startup Sensar develops landscape monitoring solutions for utilities. The startup utilizes weekly satellite observations to provide millimeter-level measurements of changes in height. Using interferometric synthetic aperture radar (InSAR) data, it measures as many as 100.000 measurements per square kilometer. This allows utility managers to better plan the deployment of new assets as well as assess damage to pipelines from ground movements.
Discover more Utility solutions
Startups such as the examples highlighted in this report focus on data visualization for smart metering, energy efficiency, and utility monitoring. While all of these technologies play a major role in advancing digital utility management, they only represent the tip of the iceberg. To explore more technologies for utility companies, simply get in touch to let us look into your areas of interest. For a more general overview, you can download one of our free Industry Innovation Reports to save your time and improve strategic decision-making.


![Dive into the Top 10 Utilities Industry Trends & Innovations [2025]](https://www.startus-insights.com/wp-content/uploads/2025/04/Utilities-Industry-Trends-SharedImg-StartUs-Insights-noresize-420x236.webp)


