Innovation is the key to thriving amidst fierce competition and meeting ever-evolving customer demands. However, innovation (management) is not without its challenges. To conquer these obstacles and drive impactful change, innovation teams are already turning to the dynamic realm of big data and analytics. Enter data visualization — a game-changing tool that revolutionizes decision-making and communication processes.
With data visualization you gain a powerful ally, transforming complex information into intuitive and compelling visual representations. By leveraging elements like charts, graphs, maps, and images, data visualization simplifies complex data sets, giving you an understanding of emerging trends and technologies thus driving actionable insights.
Beyond simplification, data visualization uncovers hidden treasures within the data. It allows you to discover trends, patterns, and outliers, empowering innovation and R&D units to make informed decisions. Moreover, it allows for seamless comparison of different scenarios and options, paving the way for strategic choices that fuel business growth.
Besides, data visualization is not limited to internal benefits. Its true power lies in its ability to captivate and engage diverse audiences. Through captivating visuals and persuasive storytelling, you can effectively communicate insights, inspire stakeholders, and win over customers or even investors. The combination of data-driven insights and compelling visuals creates an irresistible force that propels corporate innovation forward.
Today, let’s dive into the immense potential of data visualization in accelerating innovation. Join us as we explore how it unlocks a new realm of possibilities for innovation and learn how you can create visuals that leave a lasting impression.
3 Ways How Data Visualization Accelerates Innovation
Data visualization opens a world of endless possibilities, where you can seamlessly identify opportunities, generate innovative solutions, and effectively communicate your insights. Here’s how:
1. Enables You to Identify Opportunities and Trends Early
Data visualization allows you to create graphical displays of the external environment, emerging technologies, customer preferences, market gaps, or social changes. For instance, geomap is a fantastic way to visualize the distribution or concentration of data across different geographic regions. You can also use treemap, line-, bar-, pie-, and doughnut chart to create visualizations. This helps you identify patterns, correlations, outliers, and anomalies in the data. With this, you can better comprehend the current and future state of your market and discover new sources of inspiration for your innovation projects.
You might be interested in – How Data-Driven Trend Intelligence Future-Proofs Your Business
2. Allows You to Discover Solutions and Evaluate Your Options
You can cluster and evaluate possible solutions for your challenges using data visualization for innovation. Radar charts are a great example, it can be used for comprehensive evaluation and performance analysis. By using this comprehensive overview, you can weigh the advantages and disadvantages of each solution and choose the best one for further development. This approach helps you avoid bias and make informed decisions that drive business growth. It also improves your understanding of current and future market situations.
3. Makes it Easy to Communicate and Share Insights Internally & Externally
Data visualization enables you to communicate and share insights with various stakeholders inside and outside your organization. Whether you need to present your ideas to your team members, managers, investors, or customers, you can leverage data visualization. It allows you to tell engaging and persuasive stories with data. This helps you to motivate and inspire your audiences to take action.
Also read: Effective Communication: The Key to Successful Innovation
How You Can Visualize Innovation Data & Make Informed Decisions
At StartUs Insights, we develop the Discovery Platform, covering 3.7+ million startups and scaleups as well as over 20K emerging technologies and trends globally. By narrowing this data down and visualizing it, you receive a comprehensive overview of:
- Impactful industry and technology verticals
- Startup activity on a global scale
- Emerging and future technology trends
- Company profiles including funding information, company size and maturity, location, technology, and much more
Moreover, based on the platform’s data, its Visual Configurator allows you to create graphs and charts that match your business needs. For example, you can access and explore various types of data visualizations that show the most relevant and high-growth trends in your industry.
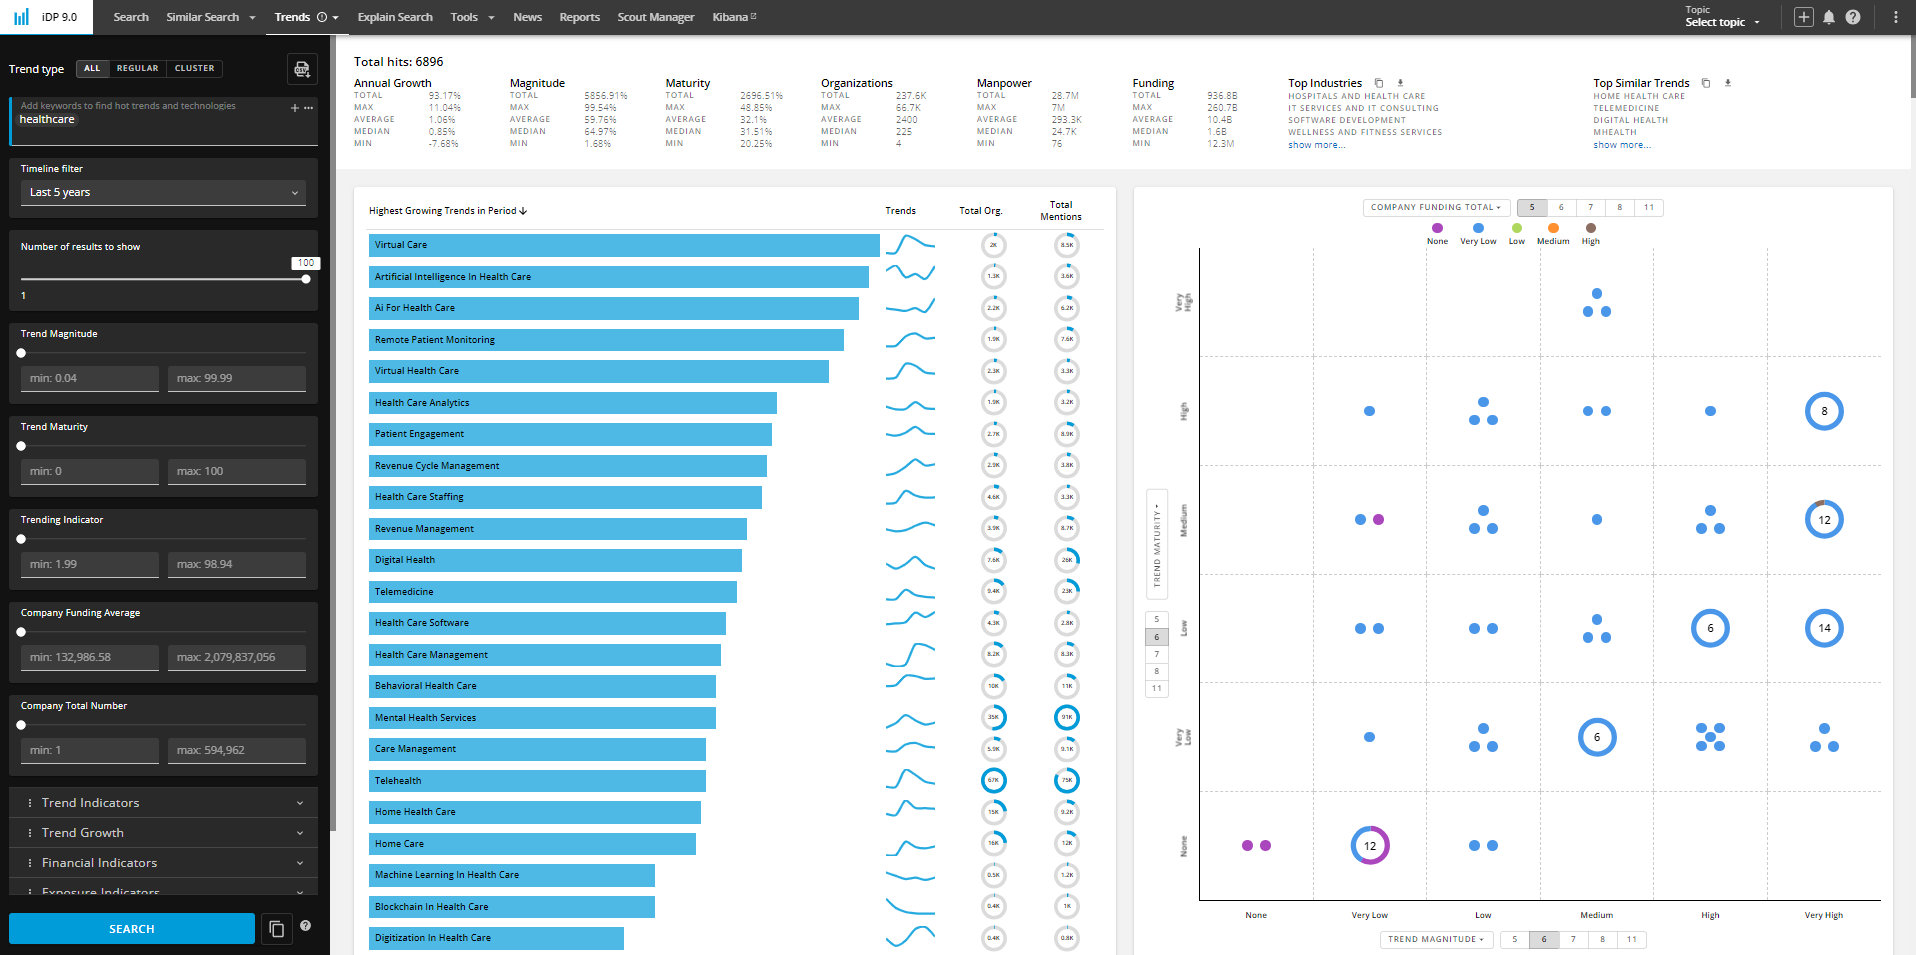
Let’s say, you want to know about the latest innovations in healthcare in the past 5 years. You can simply type “healthcare” in the keyword section and adjust the Timeline filter to 5 years. Here’s a glimpse of what you will get.
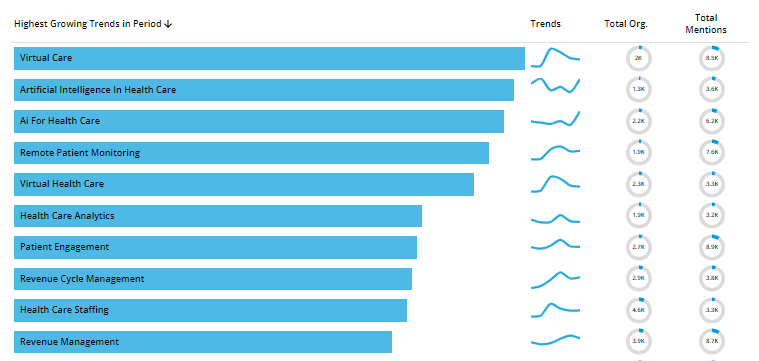
Let’s dive deeper into these insights. On the left side, you have a list of the fastest-growing trends in your chosen period. In the trend section, you have a triple chart that shows how each trend evolves over time, indicating its growth rate and potential. You also have a doughnut chart that shows the total mentions of each trend across different sources, such as news articles, social media posts, patents, and research papers.
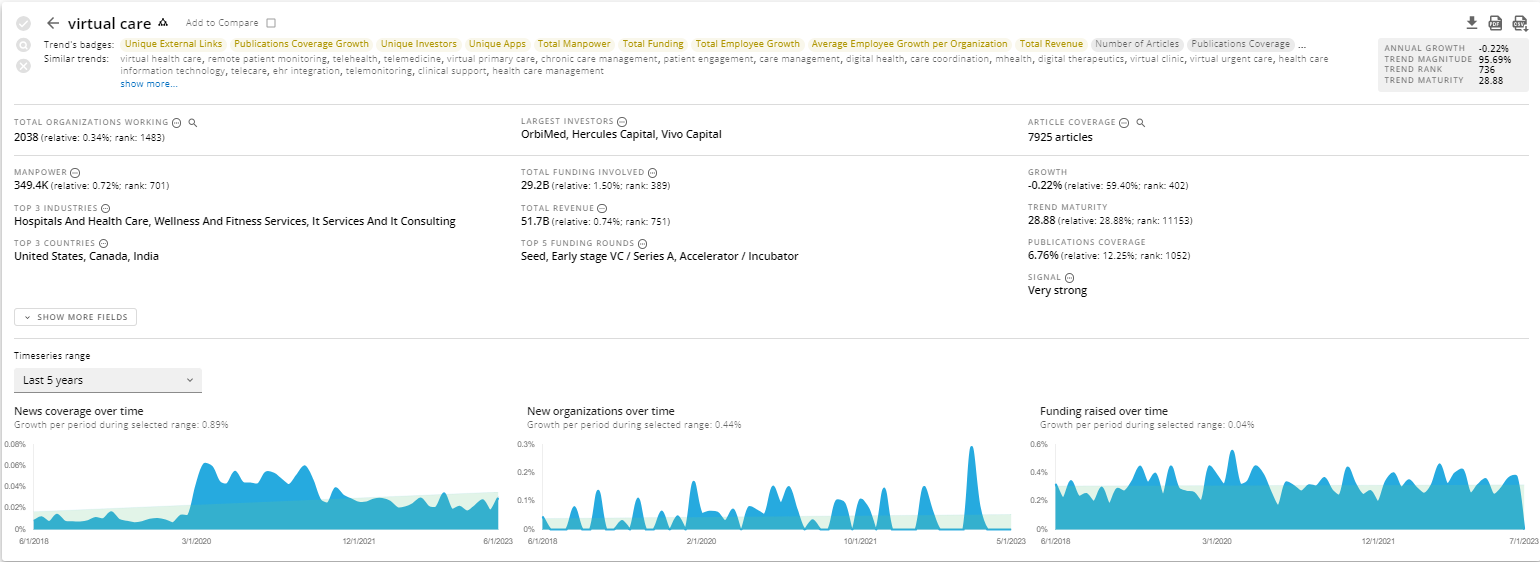
You can click on each trend to further get detailed insights. Here’s an example of the Virtual Care trend in healthcare.
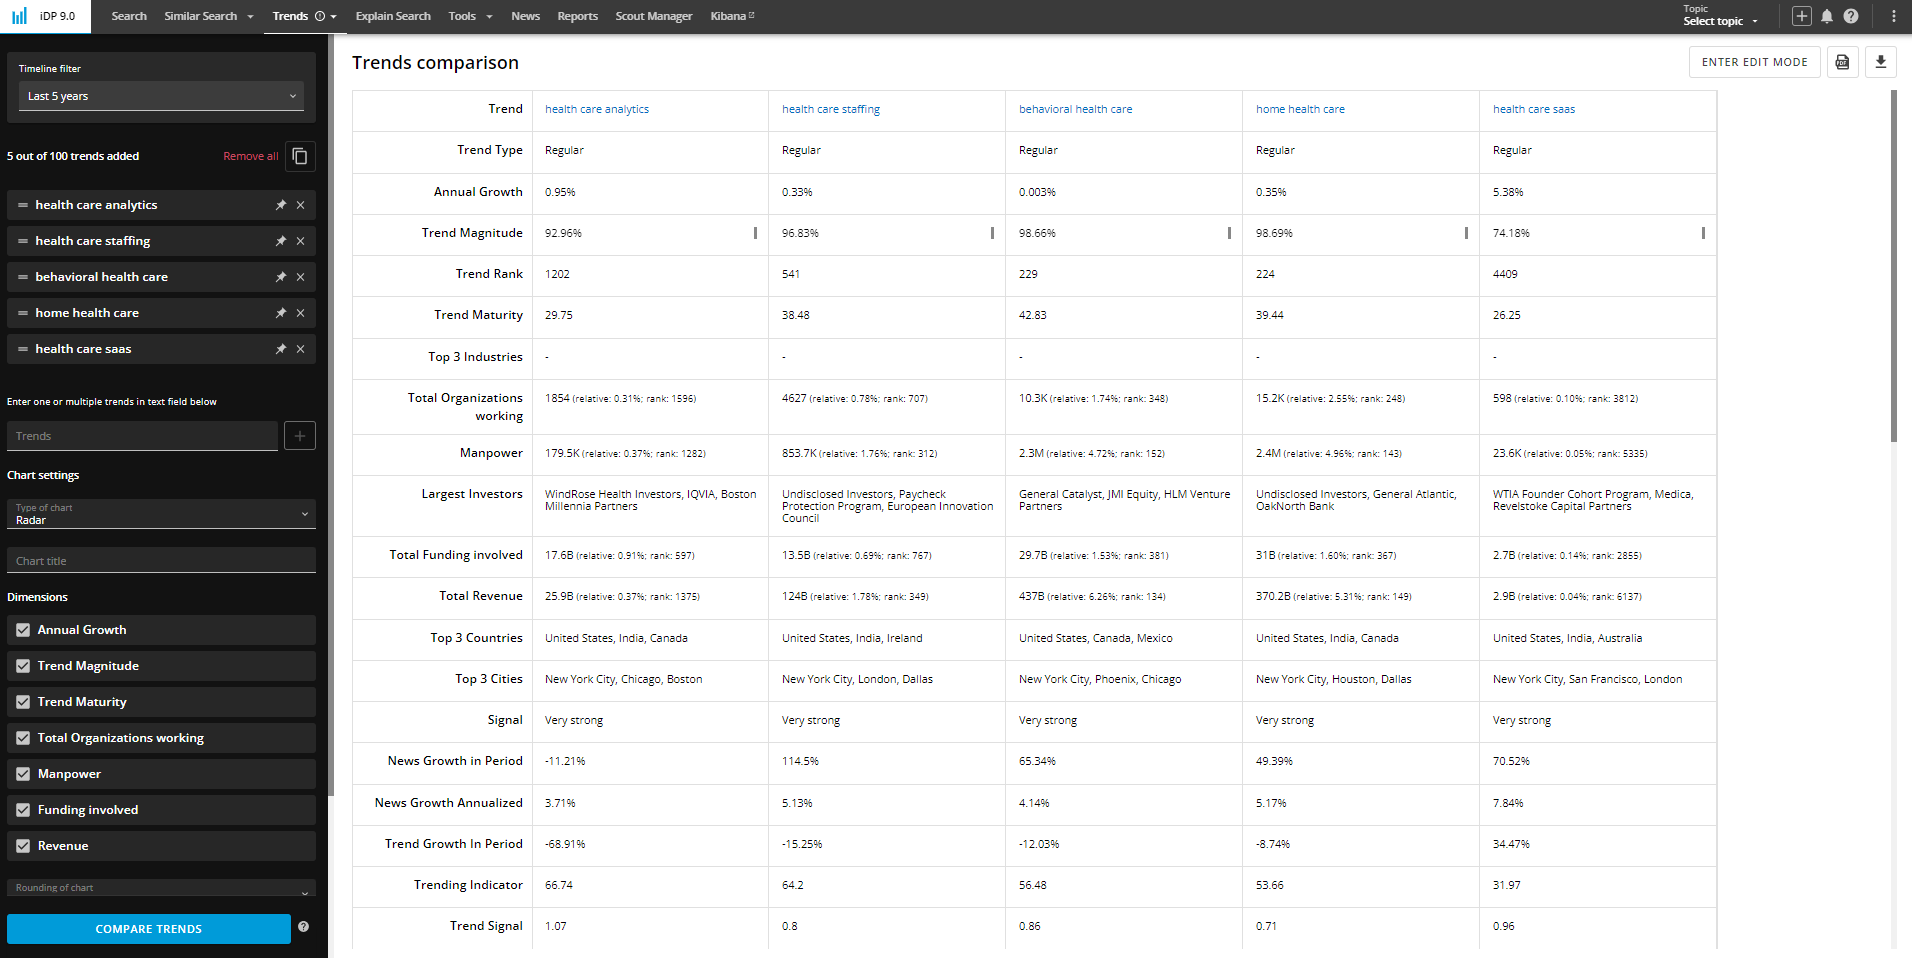
Trend Comparison
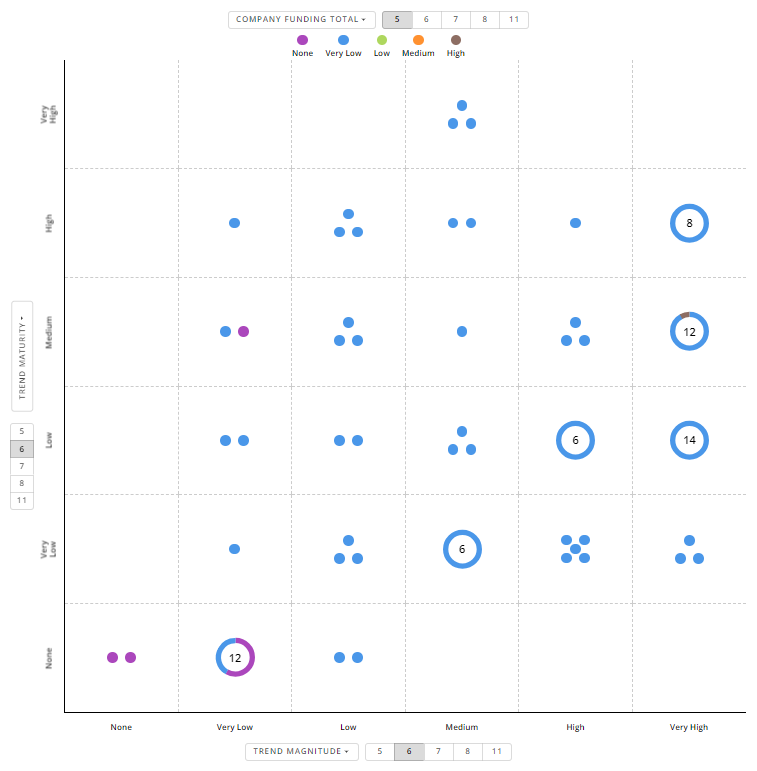
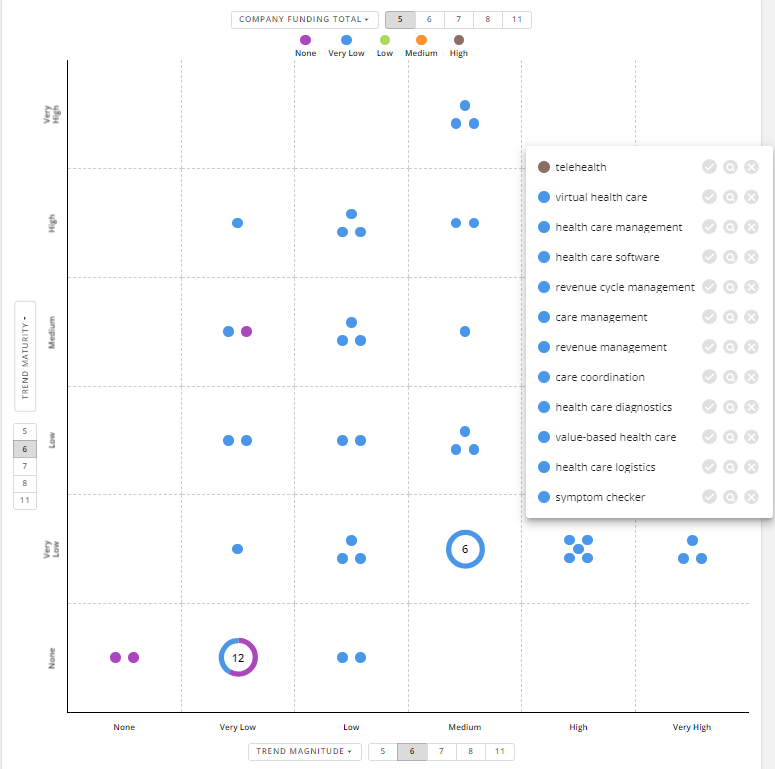
On the right side, you see a matrix chart that shows the highest growing trends in your industry based on multiple dimensions, such as trend maturity and trend magnitude. You can click on each cell to learn more about the trend and how they compare based on various dimensions.
In the Visual Configurator, you can compare these trends. What’s more, we offer an Edit mode that allows you to customize your comparison dashboard. You can change the labels and edit the data as you wish, and export it directly.
Company Comparison Made Easy with Custom Data Visualization
One of the visualizations we use most often for our clients is based on the Company Comparison Feature. This allows you to compare different emerging companies: You can customize the dimensions as per your need, including founding year, funding, team size, etc. Whether you prefer a line-, bar-, pie-, doughnut-, treemap-, or bubble chart, you can easily and quickly compare different aspects of startups and/or scaleups to accelerate your innovation management.
To sum up, data visualization is a powerful tool for innovation management, as it empowers you to adapt, thrive, and shape the future of your business. With the Discovery Platform’s Visual Configurator, you can easily create and customize your own data visualizations. You can select from a range of options for charts, graphs, and maps and adjust them to suit your needs and objectives. You can also export your data visualizations and share them with your audiences. By using data visualization to communicate and share insights, you enhance your credibility, influence, and impact.



![15 Top Market Intelligence Software Tools [2024] | StartUs Insights](https://www.startus-insights.com/wp-content/uploads/2024/03/Market-Intelligence-Software-SharedImg-StartUs-Insights-noresize-420x236.webp)
