Staying ahead of the technology curve means strengthening your competitive advantage. That is why we give you data-driven innovation insights into the energy industry. This time, you get to discover 5 hand-picked data visualization startups.
Global Startup Heat Map: 5 Top Data Visualization Startups
The 5 startups you will explore below are chosen based on our data-driven startup scouting approach, taking into account factors such as location, founding year, and relevance of technology, among others. This analysis is based on the Big Data & Artificial Intelligence (AI)-powered StartUs Insights Discovery Platform, covering over 1.3 million startups & scaleups globally.
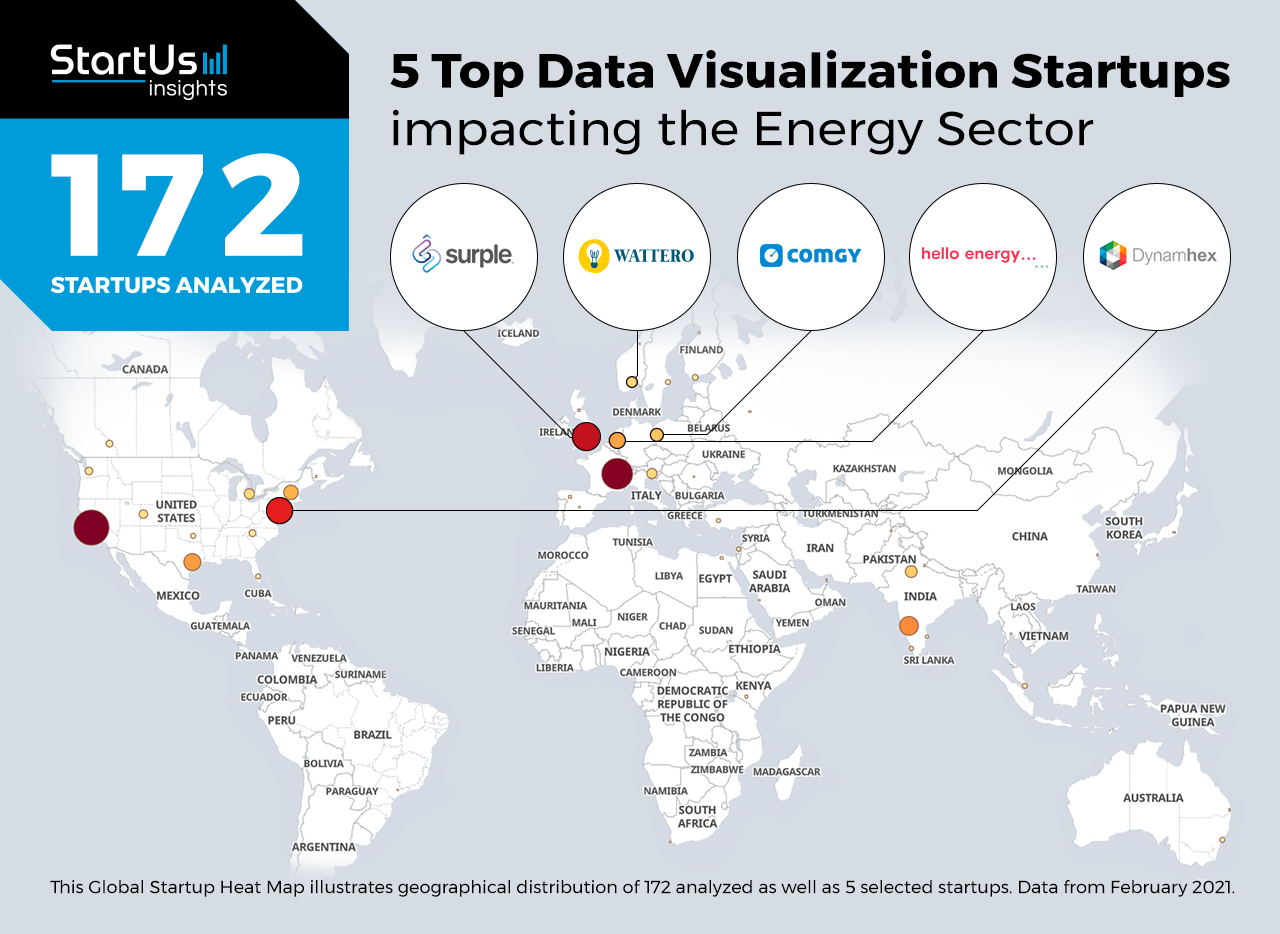
The Global Startup Heat Map below highlights the 5 data visualization startups impacting our Innovation Researchers curated for this report. Moreover, you get insights into regions that observe a high startup activity and the global geographic distribution of the 172 companies we analyzed for this specific topic.
Surple provides Energy Management Software
Managing multiple assets while optimizing production is a challenge for energy companies and utilities. Startups employ big data and analytics to derive insights from generation and consumption data at all sites. Data visualization tools make the delivery of these insights intuitive. This benefits all stakeholders by providing them a quick overview of their energy assets.
Surple is a British startup developing energy management software. The software’s dashboard enables quick visualization of a portfolio’s energy performance. It provides anomaly detection, target tracking, and expected usage analysis. Moreover, the dashboards allow energy companies to identify the highest and lowest consuming sites, as well as track the progress of targets and alarms.
Dynamhex offers Energy Consumption Visualization
Along with increasing energy regeneration from renewables, energy consumption reduction is crucial to tackling climate change. However, energy leaks and inefficient energy storage or transmission often leads to energy wastage. Data visualization solutions use energy data to identify and display the above-mentioned sinks. These solutions are available at all scales – from large energy utilities to small communities and individual homes.
Dynamhex is a US-based startup that offers an energy consumption visualization platform. The startup uses spatial data, analytics, and mathematical modeling to enable localized and standardized climate action insights. Moreover, the platform visualizes the carbon footprint and tracks key performance indicators (KPIs) to help organizations achieve energy and climate-related targets.
Wattero enables Solar Planning
Efficient integration of solar energy into the conventional grid is critical to increasing the utilization of solar power potential. Moreover, distributed energy resources increase the robustness and reliability of the grid. Energy startups use geospatial information and energy use data to identify locations for solar projects. Data visualization solutions present these insights in an accessible manner for efficient solar planning.
Norwegian startup Wattero develops solar energy projects. The startup’s Internet of Things (IoT) system gathers data from sensors and uses it to visualize energy consumption and production. The dashboard uses a user access management system and a user-friendly display to keep track of energy. The solution optimizes solar panel use in a microgrid to increase the overall availability of electricity in the grid.
hello energy visualizes Sustainability Data
Due to changing consumer priorities, an impetus on sustainability drives energy operations nowadays. Even in real-estate, consumers find energy-efficient buildings more attractive as they contribute to long-term savings in energy costs. Data visualization tools enable organizations to picture how sustainable their energy consumption is, as well as provides insights to help reach their sustainability goals.
Dutch startup hello energy provides a Software-as-a-Service (SaaS) solution to visualize sustainability measures. The startup’s energy management software visualizes energy and sustainability to enable smart energy consumption in large buildings. Further, the software provides full visibility for all stakeholders, enabling energy waste reduction.
Comgy offers Digital Sub-Metering Solutions
For many buildings, facilities such as centralized heating are added to the rent and not billed to individual apartments. However, sub-metering allows precise energy consumption to be calculated for each apartment. This incentivizes energy-saving behavior, leading to significant cost reductions. Data visualization tools enable digital sub-metering to let residents keep a track of their personal energy consumption.
Comgy is a German startup providing digital sub-metering solutions. The startup monitors gas consumption and heating costs, thereby optimizing energy usage in buildings and increasing energy savings. It also decreases the self-consumption rate of energy generated in combined heat and power (CHP) units and photovoltaic systems. The startup also offers a web app for meter gateway management.
Discover more Energy Startups
To keep you up-to-date on the latest technology and emerging solutions, we provide you with actionable innovation intelligence – quickly and exhaustively. You can download our free Energy Industry Report and discover new business opportunities or save your time & let us look into your areas of interest. We provide you with an exhaustive overview of new startups, scaleups & emerging technologies that matter to you.
